Navigate the Filing Date Chart
Published: 8/15/2023
This site's calculator shows a information dense chart of how filing dates affect your benefits. There are two versions of this chart: one for an individual, and another combined chart for couples. The combined version includes spousal benefits.
The chart can be a little confusing at first, so this is a guide to help you understand it.
Time and Money
- x-axis: Time
- y-axis: Benefit amount (in dollars)
Time
The horizontal axis is time, starting with the earliest date you can file for social security benefits and going into the future.
Featured prominently at the top of the chart is a slider (or two in the case of the combined chart). Each slider is positioned in the same horizontal time axis as the chart data. In the example below, Alex turns 63 in the middle of 2013, so that point on the slider is positioned between 2013 and 2014:
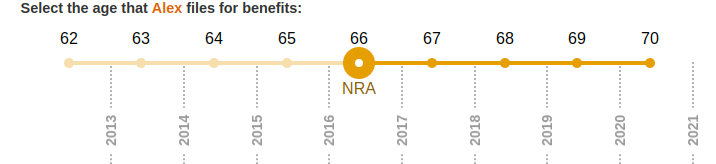
Below the slider are vertical lines indicating the matching year. The years span from when the oldest person turns 62 to when the youngest person turns 70.
SSA.tools
Free Calculator

SSA.tools Free Calculator
See how this applies to your benefits. Use the free SSA.tools calculator with your actual earnings record for personalized results.
- Copy & paste: Import your earnings record directly from SSA.gov in seconds.
- What-if scenarios: Explore how different filing ages and future earnings affect your benefit.
- 100% private: Your data never leaves your browser — nothing is stored or transmitted.
Money
The verical axis is money, specifically the benefit's paid per month. In the single user case, the $0 amount is a the bottom of the chart.
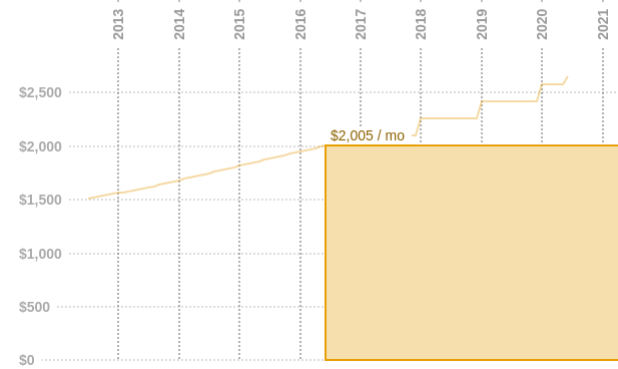
The thin curved orange line on the chart shows the starting benefit amount for each starting point in time. As you can see in the example above, if the user had started back in 2012, their benefit would have been closer to $1,500 / mo.
To see exactly what the benefit amount is at a given point in time, hover your mouse over the chart. On a touchscreen device, drag your finger across the chart. A blue vertical line will appear showing you exactly what date you have selected and the box at the bottom will show you the benefit amount for that date. Here's an example:
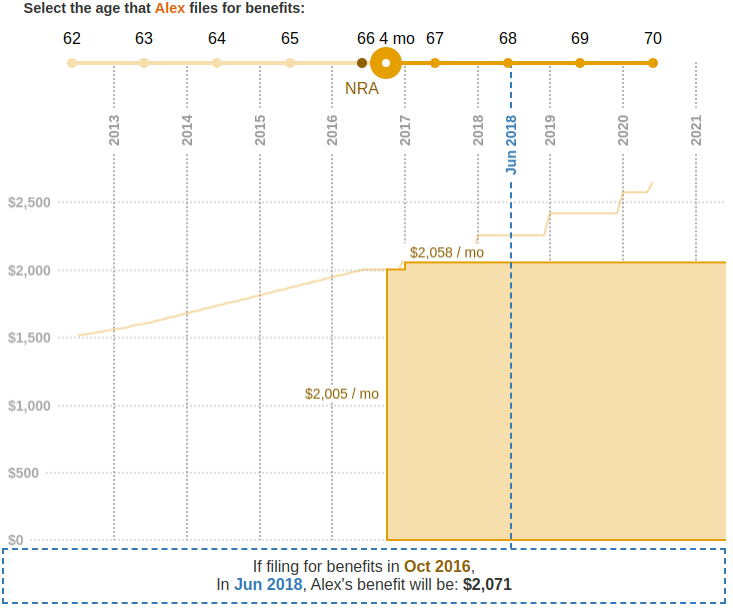
Here the user first started benefits mid-year in Oct 2016 at age 66 and 4 mo. Their benefit was initially $2,005 but increased to $2,058 in January when delayed credits were applied. On the selected date of June 2018, the benefits are $2,071 / mo.
Combined Chart
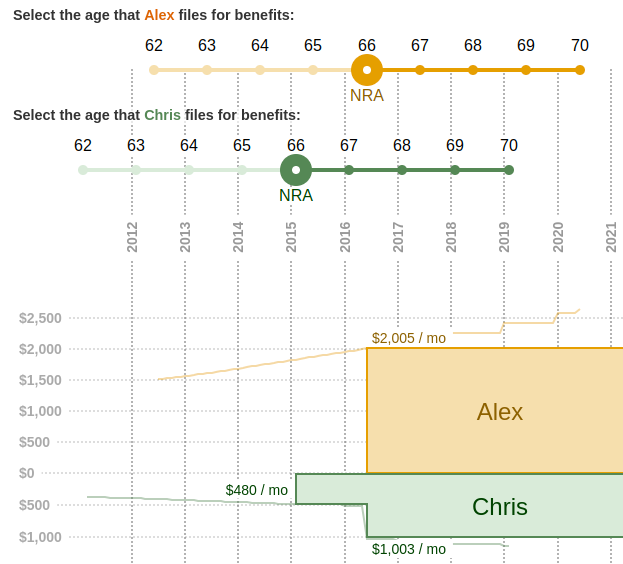
For married couples, there is also a combined chart at the bottom of the report. This chart shows the combined benefit amount for both users overlayed on the same chart. It works the same way as the single user chart, except that the second user's benefit is shown growing downward from the $0 line instead of upward. This allows both benefits to be shown on the same chart. Here's a complex example:
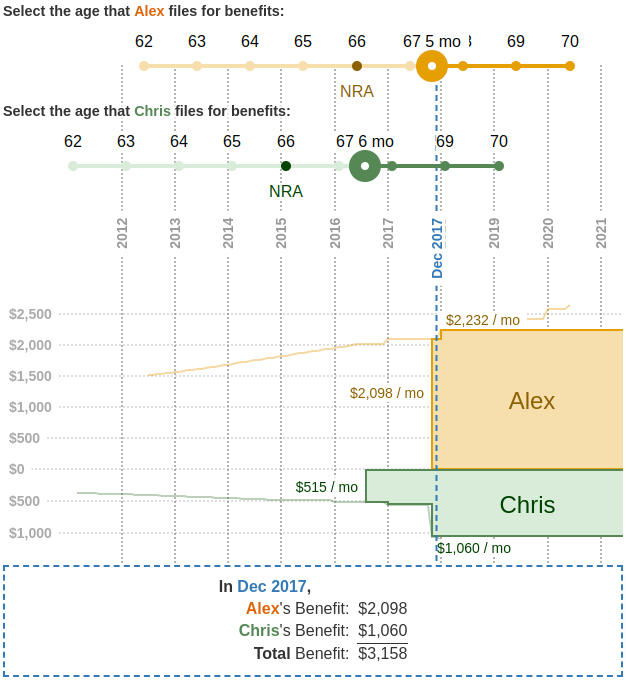
In this example, Alex's benefit starts at $2,098 / mo and rises to $2,232 / mo in January. Chris' benefit starts at $515 / mo, rises to $537 / mo in January and then rises again due to $1,060 / mo in spousal benefits when Alex files.
As the second person whose data was entered, Chris' benefits are shown growing downward from the $0 line.
Denoted by the blue line, the user has selected a date of Dec 2017 with their mouse or finger and the table at the bottom shows that in this month, the total benefit will be $3,158 which includes $1,060 from Chris' benefit and $2,098 from Alex's.
This chart is information dense, which allows it to show a lot of useful information in one place. It can be a little confusing at first, but once you understand it, it's a powerful tool for understanding your social security benefits.
Related Guides
- Primary Insurance Amount (PIA) — How your benefit amount at Normal Retirement Age is calculated
- Spousal Benefits — Why the combined chart shows different amounts for each spouse
- Delayed January Bump — Why benefits sometimes increase in January after filing mid-year
- Maximum Benefit — The highest values you might see on your benefit chart
Ready to see your own chart? Use the SSA.tools calculator to generate personalized benefit projections based on your earnings record.