SSA.tools vs OpenSocialSecurity
Published: 4/27/2026
If you have run both the ssa.tools/strategy filing optimizer and OpenSocialSecurity, you may have noticed that the two tools sometimes recommend different optimal filing dates. This guide explains why that happens, and why, in almost every realistic case, the practical impact of choosing either tool's answer is small.
Both tools are well-built implementations of the same SSA rules. The differences come from defensible choices about uncertain inputs (how long you will live, whether the trust fund runs short) and from a handful of small implementation details. There is no single "right" set of those choices.
The Optimum Is a Neighborhood, Not a Point
The most important thing to know about filing-date optimization is that the expected-value curve is very flat near its peak. Filing a few months on either side of the "optimal" date barely changes your expected lifetime benefit. Here is the strategy grid for a typical single filer:
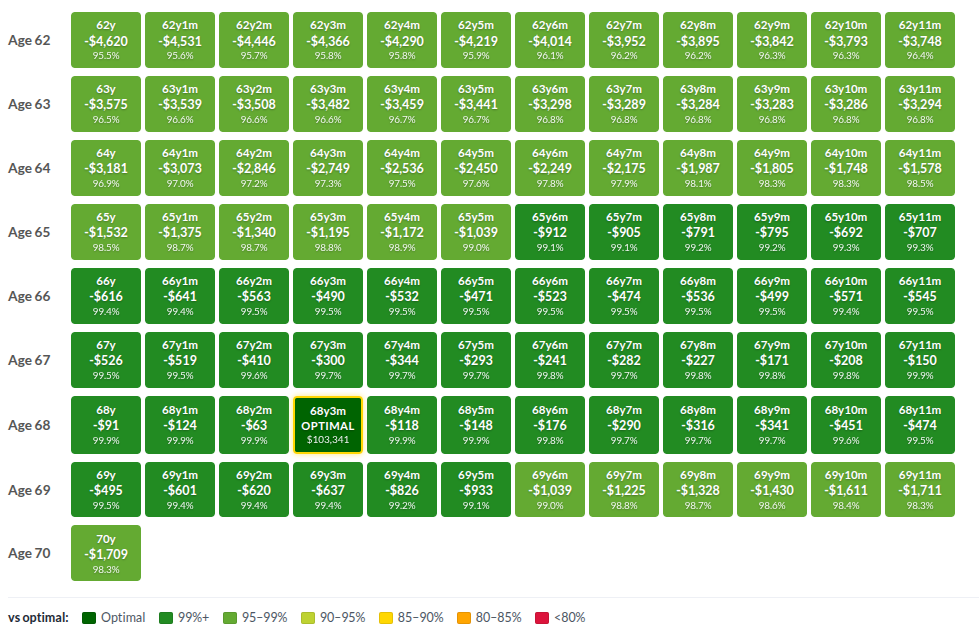
The optimal filing month here is 68 years and 3 months, with an expected lifetime benefit of $103,341. Look at what happens around that peak:
- Filing six months earlier (67y9m): about $171 less, or 99.8% of optimal.
- Filing twelve months earlier (67y3m): about $300 less, or 99.7% of optimal.
- Filing twelve months later (69y3m): about $637 less, or 99.4% of optimal.
- Filing two full years early (66y3m): about $490 less, or 99.5% of optimal.
Over an entire lifetime of benefits, the difference between the absolute best month and any month within a year of it is a few hundred dollars. So if the two tools disagree by a few months, does it matter? Not much. The lifetime dollar gap between their answers is often smaller than the uncertainty in your own life expectancy or in next year's COLA.
Where the Two Tools Differ
With the flat-optimum context in mind, here are the differences that actually move recommendations between the two tools, in rough order of impact.
Mortality model
ssa.tools/strategy uses cohort life tables. These project expected mortality improvements forward through your lifetime, so a person born in 1960 gets mortality rates that reflect anticipated medical advances over the coming decades. OpenSocialSecurity uses period life tables, which apply a single year's observed mortality rates to all future ages. Period tables generally overstate mortality for younger cohorts. The practical effect: ssa.tools/strategy tends to recommend slightly later filing dates. See our mortality tables guide for more on the difference between cohort and period tables.
Trust-fund benefit cut
OpenSocialSecurity offers an option to model a future benefit cut at trust-fund exhaustion (default 23% in 2033). When that option is on, the optimizer values dollars before the cut more highly than dollars after, pushing recommended filing earlier. ssa.tools/strategy does not model a benefit cut. If you turn the cut option off in OpenSocialSecurity, the two tools will agree more closely on this dimension. (Whether to model a cut is a personal judgment about Congressional behavior; see our guide on whether Social Security will run out.)
Partial-year delayed retirement credits
SSA has a specific rule about delayed retirement credits: credits earned in a given calendar year do not actually apply to your benefit until January of the following year, except in the month you turn 70, when all accumulated credits apply immediately. ssa.tools/strategy implements this rule. OpenSocialSecurity instead applies all accumulated credits at the filing month, which makes filing late in a year (for example, age 69 and 11 months) look slightly more attractive than it really is in practice.
Rounding and discounting precision
The Social Security Administration rounds monthly benefits down to a whole dollar. ssa.tools/strategy follows that rule. OpenSocialSecurity does not, which produces a marginally higher annual figure, at most a few dollars per month.
ssa.tools/strategy also discounts future cash flows at monthly precision, while OpenSocialSecurity discounts at annual precision. Both differences are cosmetic and never meaningfully change which filing date the optimizer prefers.
What each tool models that the other does not
Beyond the differences above, the two tools have somewhat different feature sets. OpenSocialSecurity models several scenarios that ssa.tools/strategy does not, including the earnings test for people who keep working, benefit suspension after filing, divorced-spouse benefits, child benefits, the family maximum, and disability (for people currently on SSDI who will transition to retirement benefits at full retirement age).
The two tools also approach mortality flexibility differently. OpenSocialSecurity offers a menu of alternative life tables: period tables from several years, plus Society of Actuaries smoker and nonsmoker tables for users with specific actuarial preferences. ssa.tools/strategy combines a single cohort table with a continuous health-multiplier slider and an optional blended-gender mode. Both let you adjust for your own health; they just expose it differently.
So which date should you pick?
The flat shape of the curve means any date in the neighborhood both tools point to is a good answer. Use whichever tool you find easier, and don't lose sleep over a six-month difference. There are bigger questions in a retirement plan than this one.
Related Guides
- Mortality Tables and Health Adjustments: why cohort tables are used for forward-looking planning.
- Delayed Retirement Credits: how DRCs accrue and the partial-year rule.
- Navigate the Filing Date Chart: how to read the calculator's filing-date visualization.
- Will Social Security Run Out?: background on the trust-fund question that drives one of the modeling differences.